Discrete Global Grid Systems (DGGS) are well supported in data analysis environments such as XDGGS, but there are still few ways to simply look at DGGS data in a web browser without preparing tiles or cell geometries beforehand. In a small experiment, we extended the WebGL viewer gridlook, which is developed at the Max Planck Institute for Meteorology and the German Climate Computing Center (DKRZ), with an experimental grid type for IGEO7, our equal-area aperture 7 hexagonal DGGS with Z7 indexing. The result is available as a public demo at allixender.github.io/gridlook.
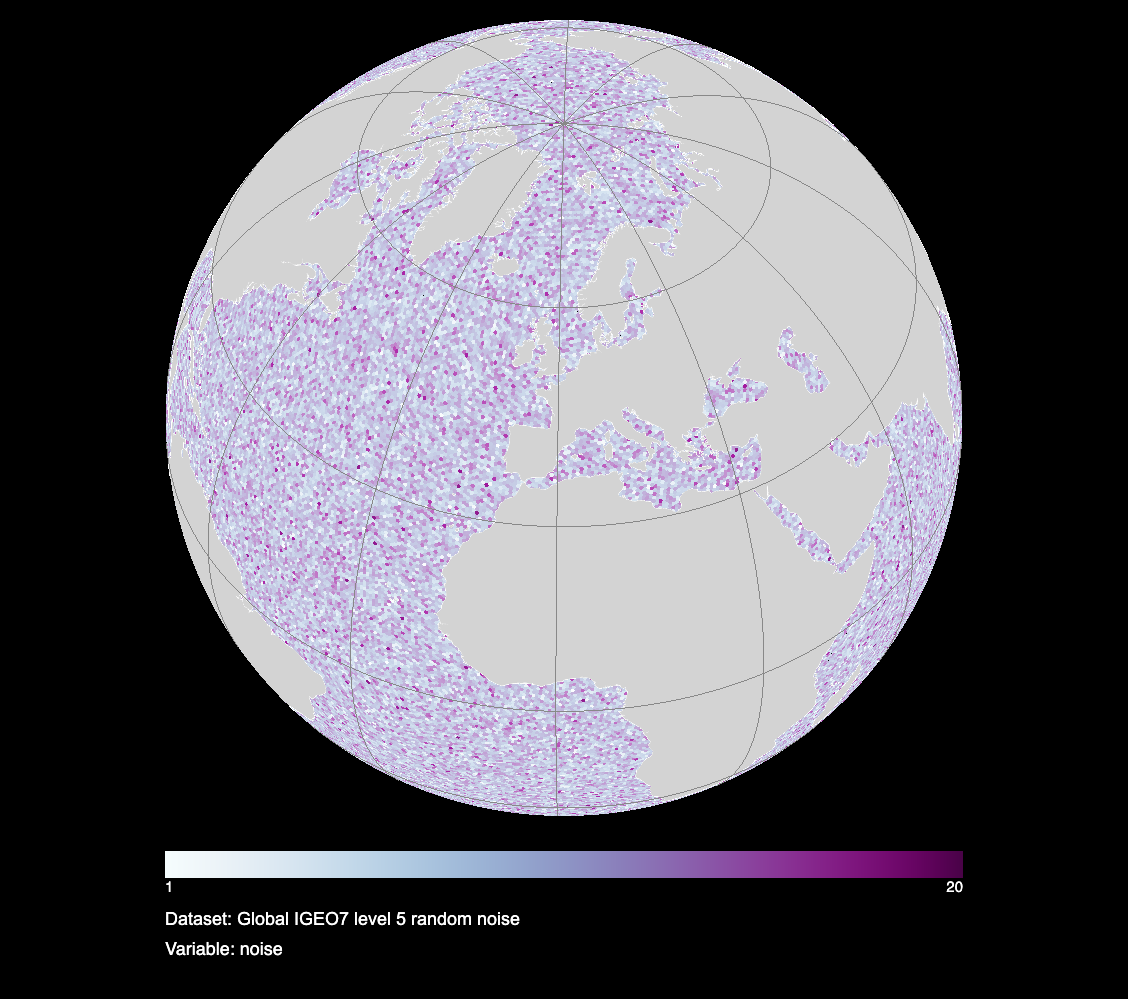
Synthetic random values on the 168 072 cells of IGEO7 refinement level 5, shown with the land layer of gridlook on top.
How it works
The demo reads Zarr archives that follow the DGGS Zarr convention and store the cell identifiers as a short table of index ranges, not as one identifier per cell. The archives were written with Xarray, XDGGS and xdggs-dggrid4py, and they contain no geometry. The browser expands the ranges to Z7 cell identifiers and computes the hexagons on the fly with DGGRID compiled to WebAssembly (webDggrid), including the IGEO7 orientation and the conversion from authalic to geodetic latitudes. For a test dataset, the cell centres and corners agree with our Python reference implementation to 1e-8 degrees.
Range-based indexes for DGGS data in Zarr were identified as a priority in the OGC AI-DGGS Disaster Management Pilot, because they keep the index small for very large collections. In the Estonian example of the demo, 11.85 million cells are described by 39 697 ranges.
Example datasets
Four example datasets can be opened from the catalogue of the demo:
- synthetic global noise at refinement levels 4 and 5 (24 012 and 168 072 cells), each stored as a single range;
- elevation around the Porijõgi catchment in south-east Estonia at level 10 (3 101 cells);
- elevation statistics for Estonia at level 12 (11.85 million cells), which are averaged in the browser to level 10 (246 620 cells) before they are drawn.
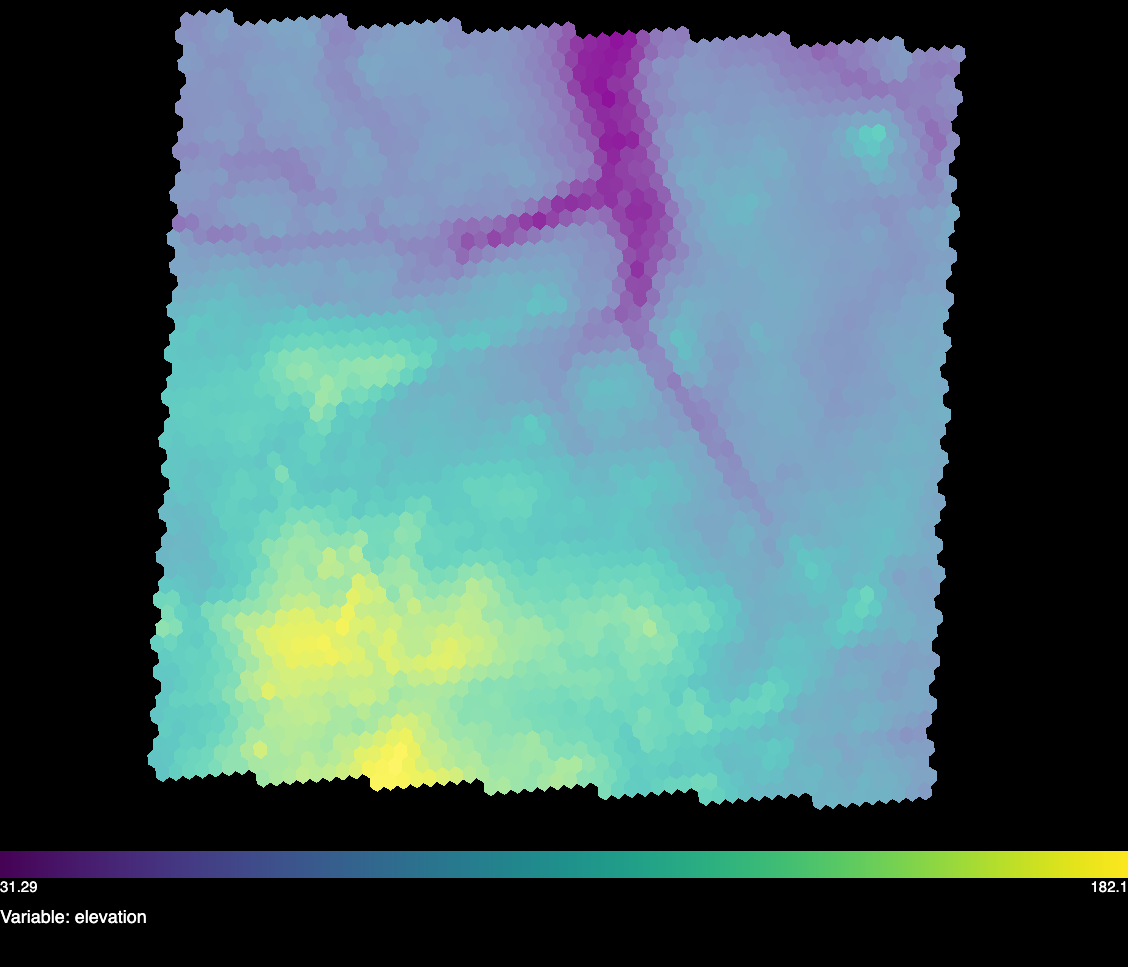
Elevation around the Porijõgi catchment at refinement level 10, where the individual hexagons are visible.
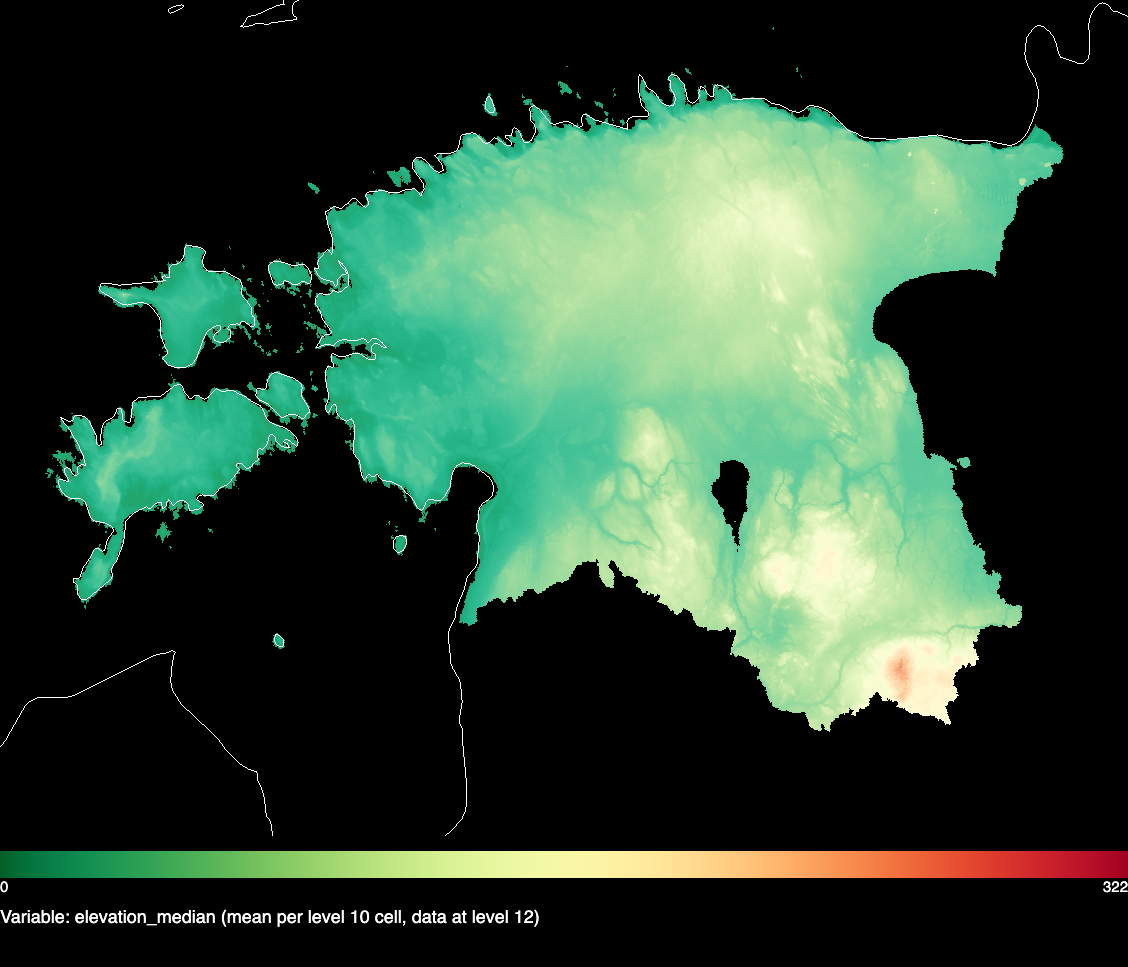
Median elevation of Estonia, stored at refinement level 12 and drawn as the mean per level 10 cell.
Limitations
The demo is a prototype and not a finished product. The hexagon corners are computed cell by cell, so the Estonian dataset takes about a minute to appear, and the aggregation in the browser currently only computes the mean. Furthermore, aggregating along the parent-child hierarchy of an aperture 7 grid is an approximation, because a parent cell does not fully cover its children (see the lessons learned in the OGC pilot). However, the experiment shows that a ranges index is well suited for web clients, because the number of cells at every coarser level follows from the range table alone, before any data value is read. This could also be useful for the discussion on overviews (pyramids) of DGGS data in Zarr.
Software and links
The demo builds entirely on the work of others, and we thank the developers of gridlook, webDggrid, DGGRID, XDGGS and Zarr. The following software and resources are involved:
- the demo at allixender.github.io/gridlook and its source code at github.com/allixender/gridlook (branch
feat/igeo7-z7-ranges, licensed under AGPL-3.0-or-later because DGGRID is included); - igeo7.org, the documentation website of IGEO7 and Z7;
- gridlook, the original viewer for Earth system model output (gridlook.pages.dev);
- webDggrid, DGGRID compiled to WebAssembly for use in the browser;
- DGGRID, the software in which IGEO7 and Z7 are implemented;
- XDGGS, xdggs-dggrid4py and dggrid4py, with which the Zarr archives were written;
- the DGGS Zarr convention, which defines the metadata and the ranges index of the archives.